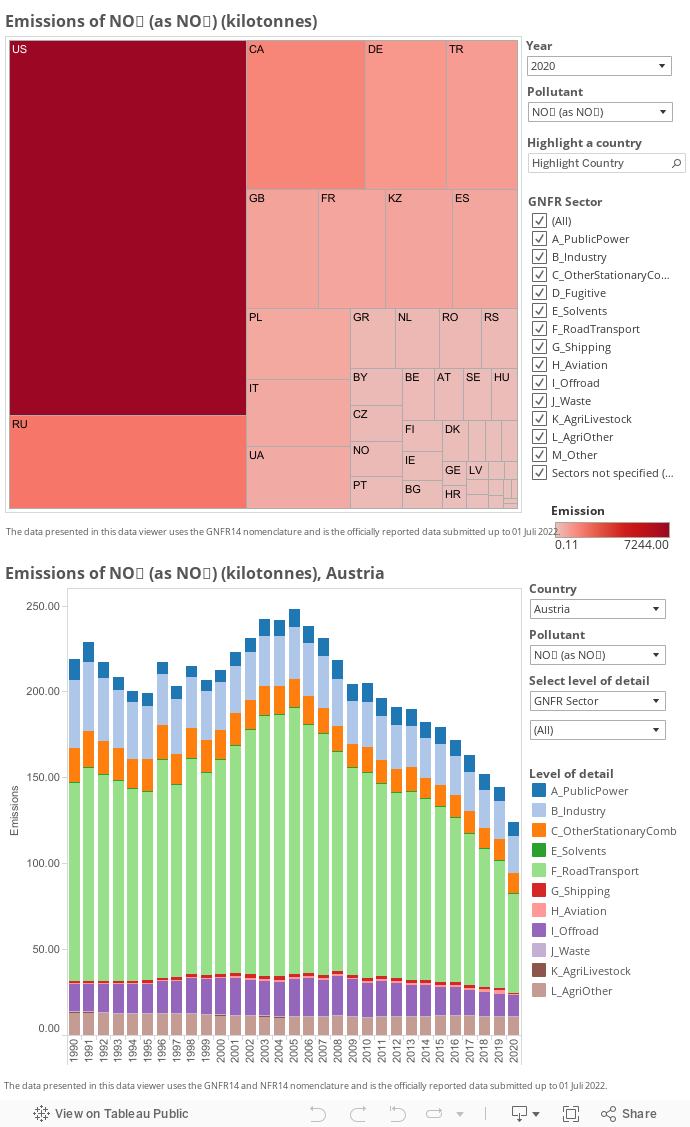
Data viewer – reported emissions data
CEIP provides its users with data viewers providing flexible, intuitive and user-friendly access to help with the analysis and visualisation of the officially reported emissions data submitted under the LRTAP Convention.
The data viewer provides a trend graph of emissions from 1990 to 2019. It shows the officially reported data provided to CEIP up to 08th September 2021. Memo items are not included in the figures. Pop-up boxes appear when the user hovers over the data. The trend graph can either be disaggregated by GNFR14 or NFR14 categories. The next update is planned during summer 2024.